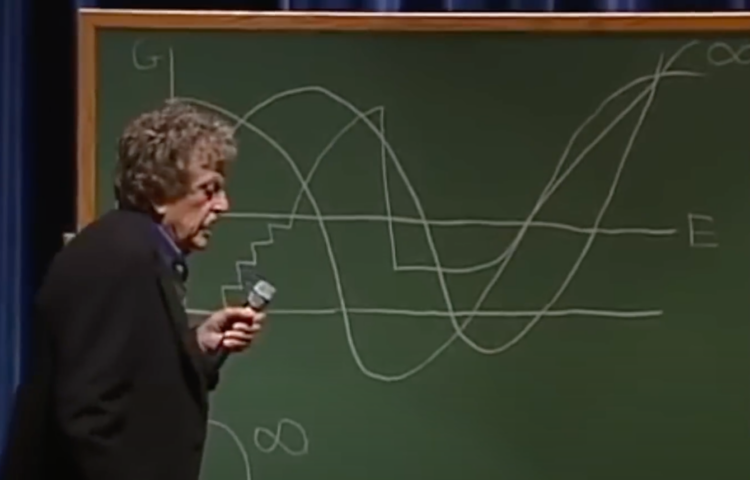
New to me, a couple decades ago, author Kurt Vonnegut delivered a lecture on the shape of stories. He uses a diagrammatic line chart to illustrate. The y-axis represents a range from ill fortune to good fortune, and the x-axis represents beginning to end of a story.
Vonnegut identifies four stories in the following video (and in a different lecture as a younger man), but poking around the internet, he seems to have illustrated eight at some point. I can’t find where the remaining four came from though.
Read More


 Visualize This: The FlowingData Guide to Design, Visualization, and Statistics